- Investor Update—Q1 2024
- Artisan Partners Developing World Team Portfolio Manager Lewis Kaufman discusses his team’s investment philosophy, portfolio positioning and the current market environment.
- Listen Now
The investment team seeks to build, preserve and enhance a stream of compounded business value. It defines this emphasis as follows:
Build
Pair low penetration domestic demand with scalable and enduring businesses that are able to drive value creation and disproportionate outcomes.
Preserve
Preserve value creation and establish a forward-looking construct for managing risk.
Enhance
Leverage value pathways to enhance long-term value creation.
| As of 30 June 2024 | QTD | YTD | 1 Yr | 3 Yr | 5 Yr | 10 Yr | Inception |
|---|---|---|---|---|---|---|---|
| Composite — Gross | 5.05 | 17.02 | 22.12 | -8.18 | 10.70 | — | 10.97 |
| Composite — Net | 4.78 | 16.43 | 20.86 | -9.15 | 9.55 | — | 9.82 |
| MSCI Emerging Markets Index | 5.00 | 7.49 | 12.55 | -5.06 | 3.09 | — | 3.71 |
| Trailing 12 Months Ended 30 June | 2020 | 2021 | 2022 | 2023 | 2024 |
|---|---|---|---|---|---|
| Composite — Gross | 39.32 | 54.28 | -48.02 | 21.91 | 22.12 |
| Composite — Net | 37.90 | 52.72 | -48.59 | 20.65 | 20.86 |
| 2019 | 2020 | 2021 | 2022 | 2023 | |
|---|---|---|---|---|---|
 |
|||||
| Composite — Gross | 43.40 | 83.46 | -8.71 | -40.56 | 30.96 |
| Composite — Net | 41.94 | 81.64 | -9.68 | -41.21 | 29.62 |
| MSCI Emerging Markets Index | 18.42 | 18.31 | -2.54 | -20.09 | 9.83 |
| As of 30 June 2024 | Average Up Month | Average Down Month |
| Composite — Net | 443bps | -376bps |
| MSCI Emerging Markets Index | 381bps | -407bps |
| Difference | +62bps | +31bps |
Based on monthly net-of-fees composite returns beginning July 1, 2015. Net-of-fees composite returns were calculated using the highest model investment advisory fees applicable to portfolios within the composite. Upside/Downside Capture represents average monthly returns during months when the index was positive and negative, respectively.
|
Top 10 Holdings (% of total portfolio as of 30 June 2024) |
|
|---|---|
| MercadoLibre Inc (Argentina) | 6.0 |
| MakeMyTrip Ltd (India) | 5.9 |
| Sea Ltd (Singapore) | 5.7 |
| NVIDIA Corp (United States) | 4.8 |
| NU Holdings Ltd (Brazil) | 4.7 |
| Airbnb Inc (United States) | 4.6 |
| Adyen NV (Netherlands) | 4.6 |
| Visa Inc (United States) | 4.6 |
| Crowdstrike Holdings Inc (United States) | 4.4 |
| Meituan (China) | 3.5 |
| Total | 48.8% |
|
Portfolio Statistics (as of 30 June 2024) |
|
|---|---|
| Median Market Cap (Billions) | $83.3 |
| Weighted Avg. Market Cap (Billions) | $286.1 |
| Number of Securities | 32 |
| Number of Countries | 9 |
| Cash (% of total portfolio) | 2.5% |
|
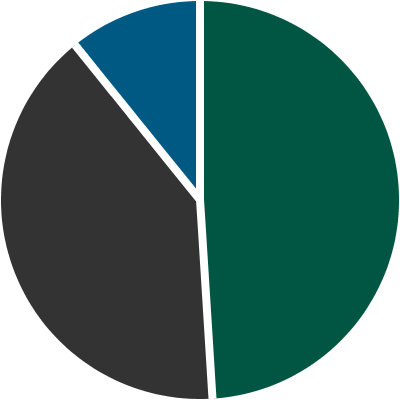
Region Allocation (% of portfolio securities as of 30 June 2024) |
|
|---|---|
|
|
| Developed Markets | 48.7 |
| Asia | 40.3 |
| Latin America | 10.9 |
| Total | 100.0% |
|
Top 10 Countries (% of portfolio securities as of 30 June 2024) |
|
|---|---|
| United States | 35.3 |
| China | 16.7 |
| India | 14.4 |
| Singapore | 9.2 |
| Netherlands | 7.9 |
| Argentina | 6.1 |
| Brazil | 4.8 |
| France | 4.3 |
| Australia | 1.3 |

.jpg)