Investment Process

The investment team seeks to invest in companies that are uniquely positioned to benefit from the growth potential in emerging markets and that possess a sustainable global competitive advantage.

Sustainable Earnings

  • Financial analysis focuses on identifying historical drivers of sustainable ROE
  • Strategic analysis examines a company's competitive advantages

Sustainability Assessment

  • Evaluate sustainability risks, including ESG considerations, via incident-based data and empirical factors
  • Use a proprietary scoring system for incident-based and empirical results to help inform the team’s view of a company’s target price

Risk Analysis

  • Assess and incorporate company-specific risks into valuation analysis
  • Assess country-appropriate macroeconomic risks to which a company is exposed

Valuation

  • Determine risk-adjusted target price based on sustainable earnings estimates, sustainability assessment and risk analysis
  • Invest in companies that are undervalued relative to peers and historical, industry, country and regional valuations

In-depth Investment Process


Investment
Results (%)

As of 31 March 2024 QTD YTD 1 Yr 3 Yr 5 Yr 10 Yr Inception
Advisor Class: APDEX 3.97 3.97 11.88 -4.62 2.71 3.99 0.69
MSCI Emerging Markets Index 2.37 2.37 8.15 -5.05 2.22 2.95 1.50
As of 31 March 2024 QTD YTD 1 Yr 3 Yr 5 Yr 10 Yr Inception
Advisor Class: APDEX 3.97 3.97 11.88 -4.62 2.71 3.99 0.69
MSCI Emerging Markets Index 2.37 2.37 8.15 -5.05 2.22 2.95 1.50

Calendar Year Returns (%)

2019 2020 2021 2022 2023
Advisor Class: APDEX 19.80 20.76 -0.63 -28.46 18.47
MSCI Emerging Markets Index 18.42 18.31 -2.54 -20.09 9.83
Returns for periods less than one year are not annualized. Artisan Sustainable Emerging Markets Fund Share Class inception: Investor (2 June 2008); Advisor (27 April 2022). For the period prior to inception, Advisor Class performance is the Investor Class’s return for that period (“Linked Performance”). Linked Performance has not been restated to reflect expenses of the Advisor Class and the share class’s returns during that period would be different if such expenses were reflected. 

Past performance does not guarantee and is not a reliable indicator of future results. Investment returns and principal values will fluctuate so that an investor's shares, when redeemed, may be worth more or less than their original cost. Current performance may be lower or higher than that shown. Performance may reflect agreements to limit a Fund’s expenses, which would reduce performance if not in effect. 

Expense Ratio

  Gross Net
Annual Report 30 September 2023 1.33% 1.05%
Prospectus 30 September 2023 1.34% 1.06%

Expense Ratio Disclosure

Net expenses reflect a contractual expense limitation agreement in effect through 31 Jan 2025. See prospectus for further details. 

Top 10 Holdings
(% of total portfolio as of 31 March 2024)
Taiwan Semiconductor Manufacturing Co Ltd (Taiwan) 11.6
Samsung Electronics Co Ltd (Korea) 7.5
ICICI Bank Ltd (India) 3.7
MediaTek Inc (Taiwan) 3.5
MercadoLibre Inc (Argentina) 3.1
E Ink Holdings Inc (Taiwan) 3.0
Reliance Industries Ltd (India) 2.9
Alibaba Group Holding Ltd (China) 2.8
Vietnam Technological & Commercial Joint Stock Bank (Vietnam) 2.6
Estun Automation Co Ltd (China) 2.5
Total 43.2%
View Full Holdings Historical Holdings
Portfolio Statistics
(as of 31 March 2024)
Median Market Cap (USD Billions) $8.7
Weighted Avg. Market Cap (USD Billions) $144.1
Weighted Harmonic Avg. P/E (FY1) 13.7X
Weighted Avg. LT EPS Growth Rate (3-5 Yr) 19.4%
Weighted Avg. ROE 16.3%
Number of Securities 59
Off-Benchmark Exposure 34.2%
Small-Cap Exposure 3.6%
Annual Turnover 28.8%
Cash (% of total portfolio) 3.4%
Region Allocation
(% of portfolio securities as of 31 March 2024)
Region Allocation chart
Emerging Asia 63.5
Latin America 20.8
Europe, Middle East and Africa 10.6
Developed Markets 5.1
Total 100.0%
Top 10 Countries
(% of portfolio securities as of 31 March 2024)
Taiwan 18.7
China 14.2
Korea 13.0
India 10.7
Brazil 7.3
Argentina 6.0
Netherlands 3.7
South Africa 3.4
Mexico 3.4
Vietnam 2.6
Sector Diversification
(% of portfolio securities as of 31 March 2024)
Consumer Goods 8.0
Extractives & Minerals Processing 9.4
Financials 19.8
Food & Beverage 1.5
Health Care 4.7
Infrastructure 3.2
Renewable Resources & Alternative Energy
Resource Transformation 8.0
Services 3.2
Technology & Communications 39.6
Transportation 2.5
Other
Total 100.0%
The investment team leverages high degrees of experience and knowledge within a disciplined investment process. Learn more about the Team.
  • Maria Negrete-Gruson, CFA
  • Portfolio Manager
  • 32Years Investment
    Experience
  • Sustainable Investing Through an Emerging Markets Lens
  • Watch Now
  • Intelligent Integration: Sustainable Investing in Emerging Markets
  • View PDF
  • ESG in Emerging Markets: A Differentiated Perspective
  • Watch Now
  • What Will Be Emerging Markets’ Next Evolution?
  • Watch Now
  • A Forward-Looking Approach to Sustainability
  • Watch Now
  • How Globalization and Global Trade Impact Emerging Markets
  • Watch Now
  • Corporate Governance Considerations in Emerging Markets
  • Watch Now
Current and future portfolio holdings are subject to risk. The value of portfolio securities selected by the investment team may rise or fall in response to company, market, economic, political, regulatory or other news, at times greater than the market or benchmark index. Investments in which the team has determined to have sustainable growth characteristics may underperform other securities and may not achieve their sustainable growth potential. A portfolio’s environmental, social and governance (“ESG”) considerations may limit the investment opportunities available and, as a result, the portfolio may forgo certain investment opportunities and underperform portfolios that do not consider ESG factors. Non-diversified portfolios may invest larger portions of assets in securities of a smaller number of issuers and performance of a single issuer may have greater impact to the portfolio's returns. International investments involve special risks, including currency fluctuation, lower liquidity, different accounting methods and economic and political systems, and higher transaction costs. These risks typically are greater in emerging and less developed markets, including frontier markets. Such risks include new and rapidly changing political and economic structures, which may cause instability; underdeveloped securities markets; and higher likelihood of high levels of inflation, deflation or currency devaluations. Securities of small- and medium-sized companies tend to have a shorter history of operations, be more volatile and less liquid and may have underperformed securities of large companies during some periods. These risks are discussed in the prospectus. Please read it carefully before you invest or send money. 

Assets under management include approximately $82 million (reported on a one-month lag) for which Artisan Partners provides investment models to managed account sponsors.

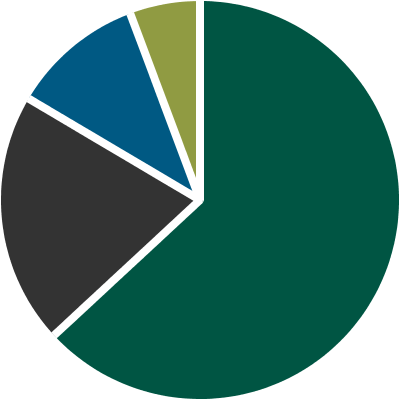
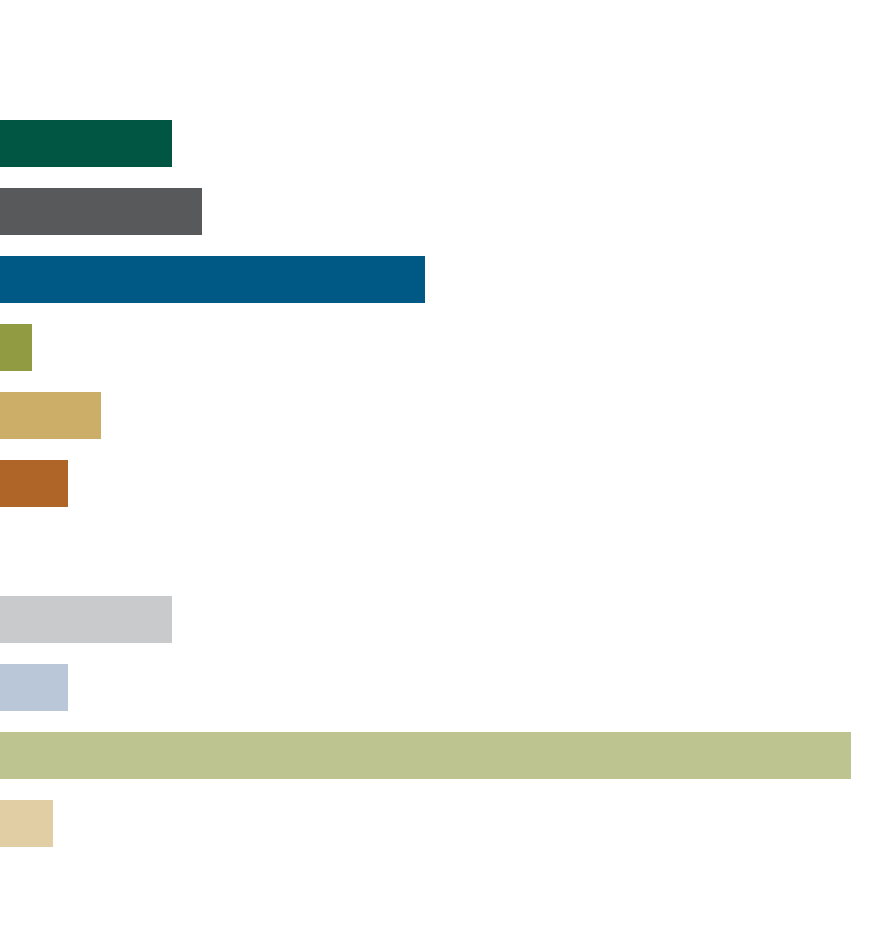
Performance Source: Artisan Partners/MSCI. Country Classification Source:  Artisan Partners. Portfolio country classifications are defined by the investment team and may differ substantially from MSCI classifications. For the portfolio’s country breakdown according to MSCI methodology, refer to the Fund’s most recent portfolio holdings on the SEC website. Sector Source: SASB. Sector exposure percentages reflect sector designations as currently classified by SICS. Data & Statistics Sources: Artisan Partners/MSCI. Annual turnover is reported as of the Fund’s fiscal year end. Artisan Partners may exclude outlier data and certain securities which lack applicable attributes, such as private securities when calculating portfolio statistics. If information is unavailable for a particular security Artisan may use data from a related security to calculate portfolio statistics. For the purpose of determining the Fund's holdings, securities of the same issuer are aggregated to determine the weight in the Fund. Cash weighting includes cash and cash equivalents. Totals may not sum due to rounding. 

Median is the data's midpoint value. Market Cap (USD) is the aggregate value of all of a company's outstanding equity securities. Market Capitalization up to $2 billion. Weighted Average is the average of values weighted to the data set's composition. Weighted Harmonic Average is a calculation of weighted average commonly used for rates or ratios. Price-to-Earnings Ratio (P/E Ratio) measures how expensive a stock is. Earnings figures used for FY1 and FY2 are estimates for the current and next unreported fiscal years. LT EPS Growth Rate is the average of the 3-5 year forecasted EPS growth rate of a company. Return on Equity (ROE) is a profitability ratio that measures the amount of net income returned as a percentage of shareholders equity. Annual Turnover is a measure of the trading activity in an investment portfolio—how often securities are bought and sold by a portfolio. 

MSCI Emerging Markets Index measures the performance of emerging markets. The index(es) are unmanaged; include net reinvested dividends; do not reflect fees or expenses; and are not available for direct investment. 

MSCI makes no express or implied warranties or representations and shall have no liability whatsoever with respect to any MSCI data contained herein. The MSCI data may not be further redistributed or used to create indices or financial products. This report is not approved or produced by MSCI. 

The Sustainable Industry Classification System (SICS®) is the exclusive intellectual property of Sustainability Accounting Standards Board (SASB). SICS is intended to group companies based on their shared sustainability-related risks and opportunities.