- About Us
- Investments
- Performance
-
News & Insights
- News
- Thought Leadership
- Research & Data
- Advanced Document Filtering
- Resources
- Account Management
- Contact
- Corporate Home
The investment team seeks to invest in companies with franchise characteristics that are benefiting from an accelerating profit cycle and are trading at a discount to private market value.

| As of 30 April 2024 | QTD | YTD | 1 Yr | 3 Yr | 5 Yr | 10 Yr | Inception |
|---|---|---|---|---|---|---|---|
| Advisor Class: APDMX | -6.30 | 3.44 | 19.46 | -4.82 | 9.20 | 9.89 | 12.59 |
| Russell Midcap® Growth Index | -5.81 | 3.14 | 20.70 | 0.70 | 9.52 | 10.85 | 9.09 |
| Russell Midcap® Index | -5.40 | 2.73 | 16.35 | 2.41 | 9.06 | 9.40 | 9.67 |
| As of 31 March 2024 | QTD | YTD | 1 Yr | 3 Yr | 5 Yr | 10 Yr | Inception |
|---|---|---|---|---|---|---|---|
| Advisor Class: APDMX | 10.40 | 10.40 | 21.98 | -0.63 | 11.63 | 9.86 | 12.91 |
| Russell Midcap® Growth Index | 9.50 | 9.50 | 26.28 | 4.62 | 11.82 | 11.35 | 9.36 |
| Russell Midcap® Index | 8.60 | 8.60 | 22.35 | 6.07 | 11.10 | 9.95 | 9.93 |
| 2019 | 2020 | 2021 | 2022 | 2023 | |
|---|---|---|---|---|---|
 |
|||||
| Advisor Class: APDMX | 38.47 | 58.98 | 10.49 | -36.74 | 24.22 |
| Russell Midcap® Growth Index | 35.47 | 35.59 | 12.73 | -26.72 | 25.87 |
| Russell Midcap® Index | 30.54 | 17.10 | 22.58 | -17.32 | 17.23 |
| Annual Report 30 September 2023 | 1.05% |
|---|---|
| Prospectus 30 September 2023 | 1.05% |
See prospectus for further details.
|
Top 10 Holdings (% of total portfolio as of 30 April 2024) |
|
|---|---|
| Chipotle Mexican Grill Inc (Consumer Discretionary) | 4.3 |
| Ascendis Pharma A/S (Health Care) | 3.3 |
| West Pharmaceutical Services Inc (Health Care) | 3.1 |
| Dexcom Inc (Health Care) | 3.1 |
| Argenx SE (Health Care) | 3.1 |
| Tyler Technologies Inc (Information Technology) | 3.0 |
| Lattice Semiconductor Corp (Information Technology) | 3.0 |
| Spotify Technology SA (Communication Services) | 2.8 |
| Ingersoll Rand Inc (Industrials) | 2.7 |
| HubSpot Inc (Information Technology) | 2.7 |
| Total | 31.1% |
|
Portfolio Statistics (as of 30 April 2024) |
|
|---|---|
| Median Market Cap (Billions) | $25.1 |
| Weighted Avg. Market Cap (Billions) | $32.0 |
| Weighted Harmonic Avg. P/E (FY1) | 36.5X |
| Weighted Harmonic Avg. P/E (FY2) | 31.3X |
| Weighted Avg. Hist. 3 Yr Sales Growth | 29.1% |
| Weighted Avg. LT Debt/Capital | 28.8% |
| Active Share | 80.8% |
| Annual Turnover | 46.9% |
| Number of Securities | 66 |
| Cash (% of total portfolio) | 1.6% |
|
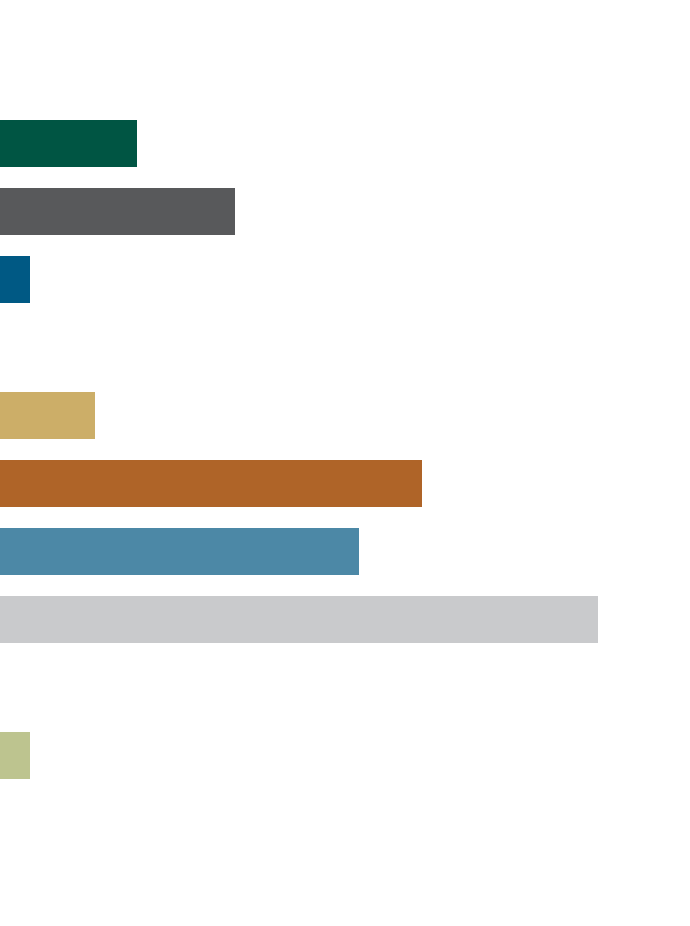
Market Cap Distribution (% of portfolio securities as of 30 April 2024) $ in billions |
|
|---|---|
| 41.4+ | 26.6 |
| 30.9–41.4 | 15.2 |
| 21.1–30.9 | 21.8 |
| 12.4–21.1 | 14.8 |
| 0.0–12.4 | 21.6 |
| TOTAL | 100.0% |
|
Sector Diversification (% of portfolio securities as of 30 April 2024) |
|
|---|---|
| Communication Services | 7.2 |
| Consumer Discretionary | 12.3 |
| Consumer Staples | 1.6 |
| Energy | — |
| Financials | 5.0 |
| Health Care | 22.1 |
| Industrials | 18.8 |
| Information Technology | 31.3 |
| Materials | — |
| Real Estate | 1.6 |
| Utilities | — |
| Other | — |
| Total | 100.0% |