A hypothetical portfolio consisting of $1 million invested at the inception of each of the strategies we have managed over the course of our history would have grown from $23 million to approximately $134 million at December 31, 2021, after fees. That is $56 million (or 70.8%) more than a portfolio consisting of each strategy’s corresponding passive index.
 |
Data as of and through December 31, 2021. Sources: Artisan Partners/MSCI/Russell/ICE BofA/S&P. Calculation is based on investing $1 million in each Artisan composite offered over the course of our history and its respective market index for the period since the composite's inception. An investment cannot be made directly in an Artisan composite or a market index and the aggregated results are hypothetical. Past performance is not indicative of future results. See Disclosures for more information about how we calculate our investment performance and the benchmarks used.
Net of fees, Artisan Partners' investment strategies have outperformed their benchmark indices in the majority of rolling 5-year periods, demonstrating that our investment teams have added value across multiple market environments.
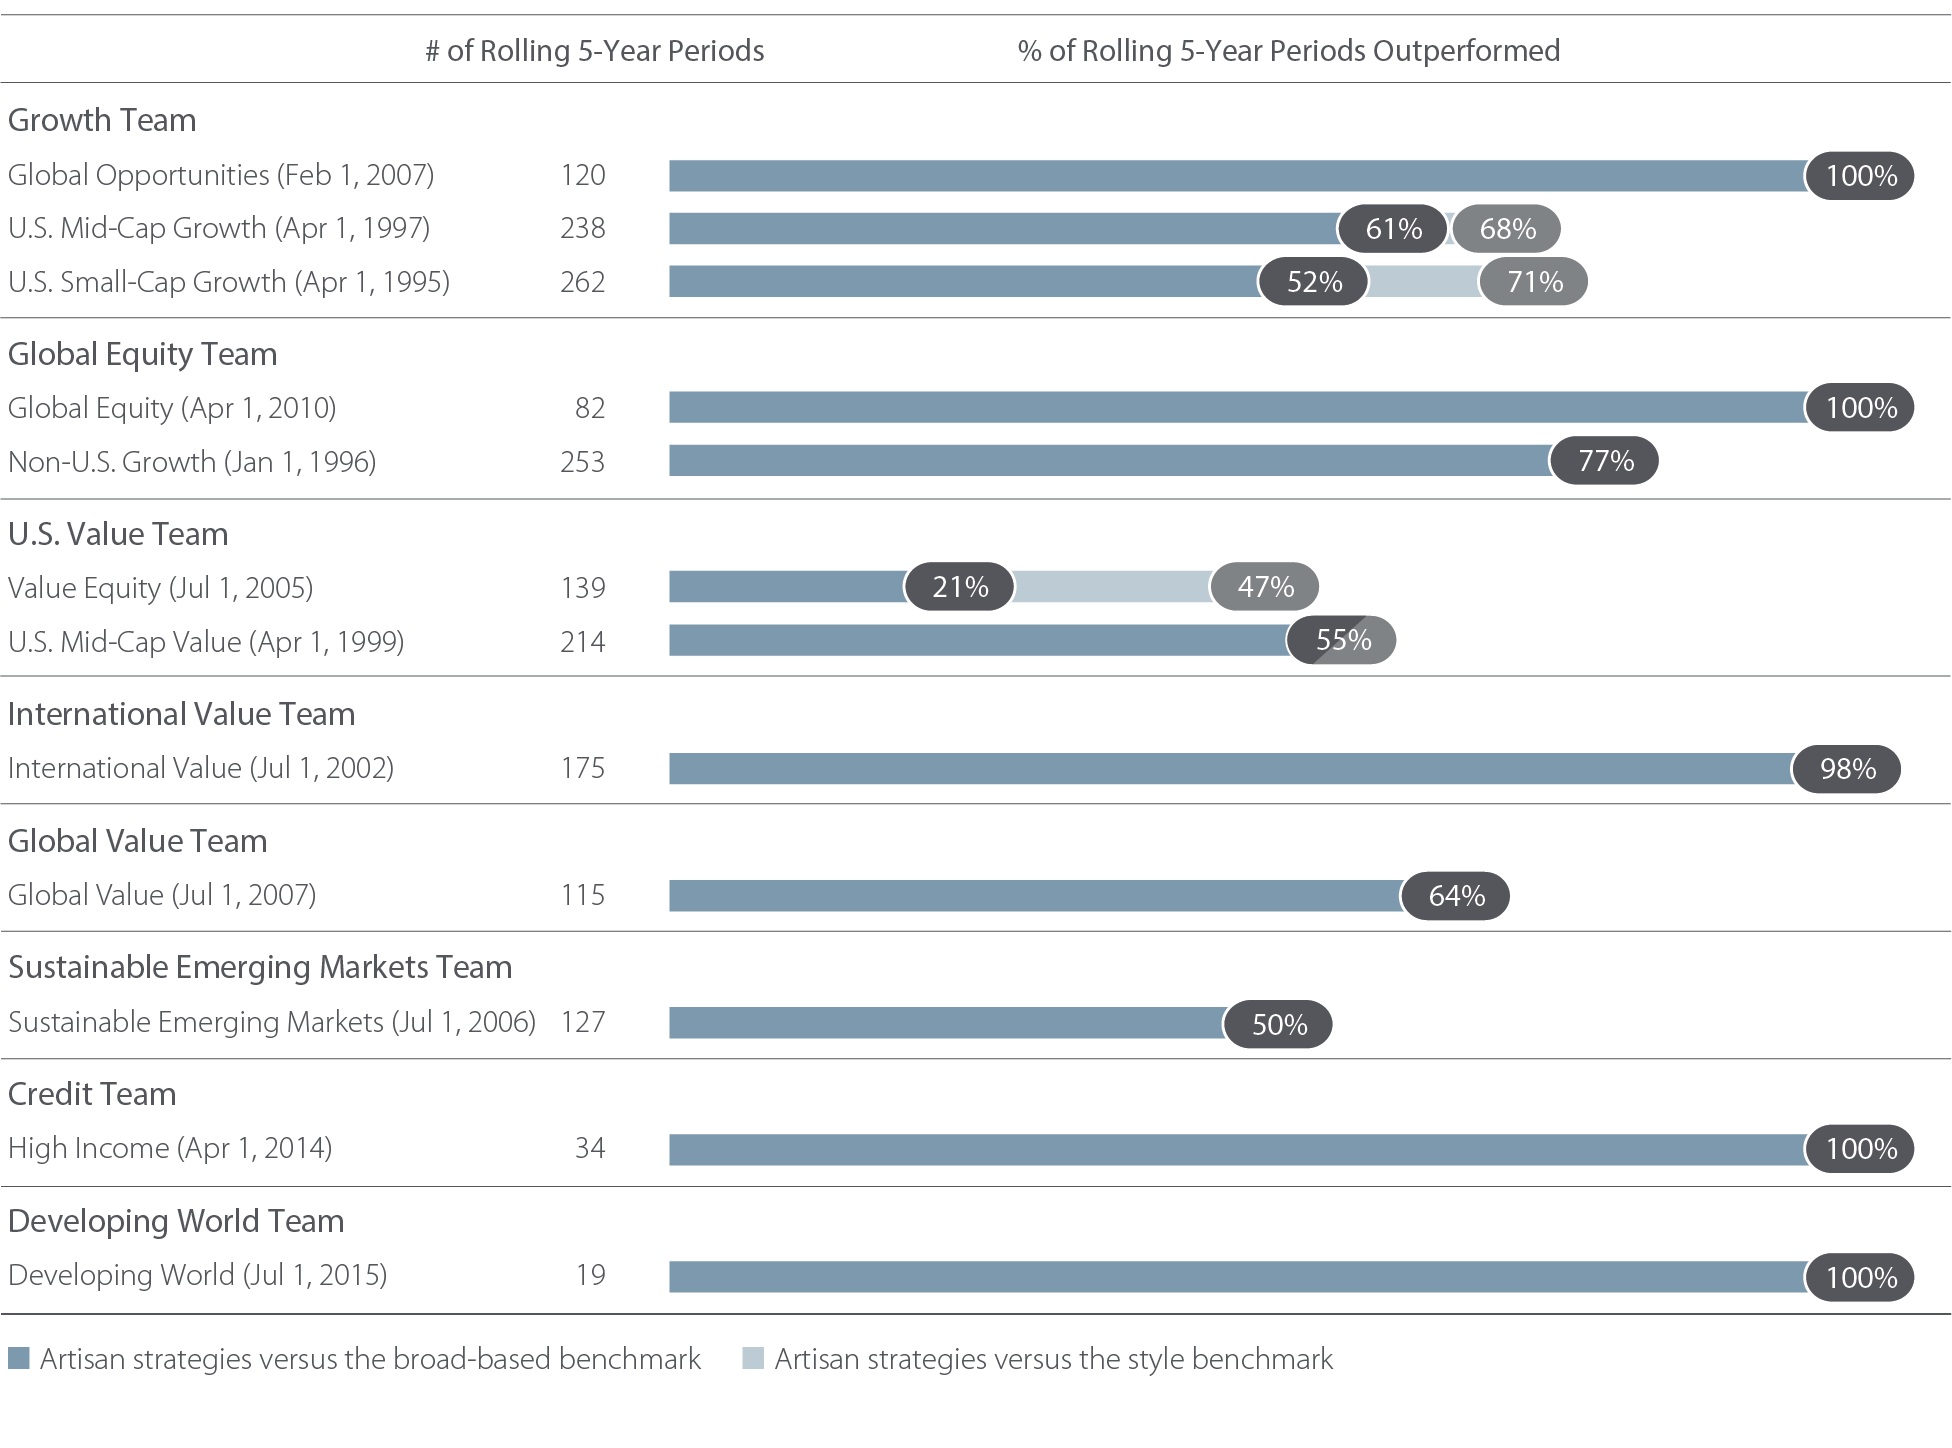
Data as of and through December 31, 2021. Sources: Artisan Partners/MSCI/Russell/ICE BofA/S&P. The dark blue line indicates the percent of periods each Artisan composite outperformed its broad-based market index, and the lighter blue line indicates the periods that the U.S. Mid-Cap Growth, U.S. Small-Cap Growth, Value Equity and U.S. Mid-Cap Value strategies outperformed their style indexes. Percent of periods outperformed is the percentage of total rolling 5-year periods in which the Artisan composite, net of fees, outperformed its respective market index. The performance over rolling periods is based on monthly returns for each Artisan composite that has completed a 5-year return period. Artisan U.S. Small-Cap Value, which reorganized into Artisan U.S. Mid-Cap Value in May 2016, outperformed its market index in 77% of the 168 rolling 5-year periods during its existence. The Artisan Non-U.S. Small-Cap Growth composite, which terminated on November 30, 2018, outperformed its market index in 75% of the 144 rolling 5-year periods during its existence. Past performance is not indicative of future results. See Disclosures for more information about how we calculate our investment performance and the benchmarks used.
| 1 Yr | 3 Yr | 5 Yr | 10 Yr | Inception | Value-Added (bps) |
|
|---|---|---|---|---|---|---|
| Growth Team | ||||||
| Artisan Global Opportunities Strategy—Feb 1, 2007 | 14.23 | 29.60 | 21.21 | 17.32 | 12.34 | 532 |
| MSCI All Country World Index | 18.54 | 20.36 | 14.39 | 11.84 | 7.02 | |
| Artisan Global Discovery Strategy—Sep 1, 2017 | 12.94 | 33.21 | — | — | 22.69 | 963 |
| MSCI All Country World Index | 18.54 | 20.36 | — | — | 13.06 | |
| Artisan U.S. Mid-Cap Growth Strategy—Apr 1, 1997 | 10.66 | 34.37 | 23.09 | 17.53 | 15.50 | 437/478 |
| Russell Midcap® Index | 22.58 | 23.26 | 15.09 | 14.89 | 11.13 | |
| Russell Midcap® Growth Index | 12.73 | 27.43 | 19.82 | 16.61 | 10.72 | |
| Artisan U.S. Small-Cap Growth Strategy—Apr 1, 1995 | -8.70 | 27.44 | 21.95 | 17.05 | 11.09 | 126/242 |
| Russell 2000® Index | 14.82 | 20.00 | 12.01 | 13.22 | 9.83 | |
| Russell 2000® Growth Index | 2.83 | 21.14 | 14.52 | 14.12 | 8.67 | |
| Global Equity Team | ||||||
| Artisan Global Equity Strategy—Apr 1, 2010 | 5.64 | 21.46 | 18.09 | 14.78 | 12.98 | 288 |
| MSCI All Country World Index | 18.54 | 20.36 | 14.39 | 11.84 | 10.10 | |
| Artisan Non-U.S. Growth Strategy—Jan 1, 1996 | 9.07 | 14.98 | 12.29 | 9.37 | 9.28 | 403 |
| MSCI EAFE Index | 11.26 | 13.53 | 9.54 | 8.02 | 5.25 | |
| Artisan Non-U.S. Small-Mid Growth Strategy—Jan 1, 2019 | 4.13 | 24.07 | — | — | 24.07 | 936 |
| MSCI All Country World ex USA SMID Index | 10.16 | 14.71 | — | — | 14.71 | |
| Artisan China Post-Venture Strategy—Mar 1, 2021 | — | — | — | — | -10.82 | 363 |
| MSCI China SMID Cap Index | — | — | — | — | -14.45 | |
| U.S. Value Team | ||||||
| Artisan Value Equity Strategy—Jul 1, 2005 | 23.60 | 21.08 | 12.06 | 12.11 | 8.84 | -223/41 |
| Russell 1000® Index | 26.45 | 26.18 | 18.41 | 16.53 | 11.07 | |
| Russell 1000® Value Index | 25.16 | 17.62 | 11.16 | 12.96 | 8.43 | |
| Artisan U.S. Mid-Cap Value Strategy—Apr 1, 1999 | 26.59 | 18.32 | 10.09 | 10.75 | 11.92 | 149/164 |
| Russell Midcap® Index | 22.58 | 23.26 | 15.09 | 14.89 | 10.43 | |
| Russell Midcap® Value Index | 28.34 | 19.60 | 11.21 | 13.43 | 10.28 | |
| International Value Team | ||||||
| Artisan International Value Strategy—Jul 1, 2002 | 17.03 | 16.57 | 10.70 | 10.76 | 11.05 | 446 |
| MSCI EAFE Index | 11.26 | 13.53 | 9.54 | 8.02 | 6.59 | |
| Artisan International Explorer Strategy—Nov 1, 2020 | 18.38 | — | — | — | 38.11 | 670 |
| MSCI All Country World Index Ex USA Small Cap | 12.93 | — | — | — | 31.41 | |
| Global Value Team | ||||||
| Artisan Global Value Strategy—Jul 1, 2007 | 15.85 | 15.36 | 10.35 | 11.31 | 8.13 | 153 |
| MSCI All Country World Index | 18.54 | 20.36 | 14.39 | 11.84 | 6.60 | |
| Artisan Select Equity Strategy—Mar 1, 2020 | 16.00 | — | — | — | 20.72 | -1108 |
| S&P 500® Index | 28.71 | — | — | — | 31.80 | |
| Sustainable Emerging Markets Team | ||||||
| Artisan Sustainable Emerging Markets Strategy—Jul 1, 2006 | -1.27 | 13.27 | 11.53 | 6.62 | 5.68 | -4 |
| MSCI Emerging Markets Index | -2.54 | 10.93 | 9.87 | 5.48 | 5.72 | |
| Credit Team | ||||||
| Artisan High Income Strategy—Apr 1, 2014 | 6.45 | 10.27 | 7.61 | — | 7.18 | 182 |
| ICE BofAML US High Yield Master II Index | 5.36 | 8.56 | 6.09 | — | 5.36 | |
| Artisan Credit Opportunities Strategy—Jul 1, 2017 | 14.05 | 14.39 | — | — | 10.78 | 933 |
| ICE BofA US Dollar LIBOR 3-month Constant Maturity Index | 0.17 | 1.28 | — | — | 1.45 | |
| Developing World Team | ||||||
| Artisan Developing World Strategy—Jul 1, 2015 | -9.68 | 32.51 | 21.67 | — | 15.95 | 984 |
| MSCI Emerging Markets Index | -2.54 | 10.93 | 9.87 | — | 6.11 | |
| Antero Peak Group | ||||||
| Antero Peak Strategy—May 1, 2017 | 23.95 | 28.68 | — | — | 26.83 | 871 |
| S&P 500® Index | 28.71 | 26.04 | — | — | 18.12 | |
| Antero Peak Hedge Strategy—Nov 1, 2017 | 18.73 | 20.92 | — | — | 18.06 | 2 |
| S&P 500® Index | 28.71 | 26.04 | — | — | 18.04 | |
Data as of and through December 31, 2021. Source: Artisan Partners/MSCI/Russell/ICE BofA/S&P. Average Annual Total Returns presents composite, net of fees, performance for each strategy. Periods less than one year are not annualized. Past performance is not indicative of future results. See Disclosures for more information about the calculation of our investment performance. The Credit Team's Floating Rate strategy composite performance began on January 1, 2022. As a result there is no performance track record as of December 31, 2021. Artisan International Small Cap Value strategy was renamed Artisan International Explorer strategy effective March 31, 2022.